Course Recommendations:
- Although these strategies are simple, in our opinion it will take a lot of discipline and hard work to follow them. This is due to the fact that they guide you to use proper risk management and to be very selective in the trades you place and when you trade. The strategies also require a lot of preparation and planning. Therefore discipline is essential to success. And we all know that it is not easy to stay disciplined.
- This course will outline two foundation strategies. These strategies do not generate trading signals often, however when properly set up they can provide you with excellent trade opportunities.
- Please keep in mind that in order to achieve the most success from this course you need to have a basic knowledge of placing trades, the Forex market and basic chart analysis. If you need to get acquainted with the basics of Forex trading you will greatly benefit from the Trading Basics tutorials .
- In order to gain the greatest benefit from this course please read the material very carefully and practice the analysis on Forex charts. Although this course is technical in nature many traders believe a combination of technical and fundamental analysis is necessary in Forex trading.
- There are some common themes throughout this course that are very important to pay attention to: First, this course is just a guideline. The methods outlined here can be effective but the idea is to pay attention to the overall theme of support and resistance in conjunction with a confirming catalyst. You can build on the foundation by applying other technical or fundamental principles.
- In addition there are two crucial aspects of the course that you need to pay attention to: First, be very selective of the trades you take and make sure that the trade set up is perfect relative to your rules. Secondly, use proper risk management. Make sure that your trade is small enough to make another trade in case you are wrong. The bottom line is, if you want to be successful do not gamble.
- Keep in mind that Forex trading can be very risky with any strategy. Basically don’t risk money that you cannot afford to lose.
- Of course, as you know these strategies are for educational purposes only, so we suggest that you practice these strategies on a demo account before risking your money.
The Theories Behind The Effectiveness Of The Support And Resistance Concept:
This section seeks to teach you the concept of support and resistance, as well as the reasoning behind its effectiveness. Increasing your knowledge and understanding of support and resistance is a vital element. The better you understand the concepts and theories, the more effective you will be in applying the concepts taught in this course to your actual trading.
You will also be presented with various triggers that when combined with support and resistance knowledge can generate outstanding trade setups.
The majority of Forex traders have heard about support and resistance, and many of these traders use support and resistance in their trading. However, very few understand the true potential that support and resistance presents in the Forex market.
Using the concepts taught in this course, you will be able to create trade setups that have great potential and will be able to help you identify where and when you should enter and exit your trades.
However, to do this you must first become proficient at identifying support and resistance levels.
The Pizza Incident – Why The Price Reacts To The Support And Resistance Area?
To remind yourself of how support and resistance works, think of a freshly baked pizza. Similar to the pizza example, prices in the Forex market react to “hot” zones.
Have you ever tried to pull a pizza out of the oven only to encounter the pain of a hot pan? Your first reaction may be to pull your hand away from the pan and it will take you a while before you attempt to pull the pizza out again. When you attempt to do so again, you will most likely proceed with more caution than before, and will likely test to see if the pan is still too hot.
The Pizza Incident Examples:
Take the example of the AUD/USD. In August of 2003 the pair approached the 0.6340 price area only to find that it was too hot to handle:
Click on the image to open the full size version!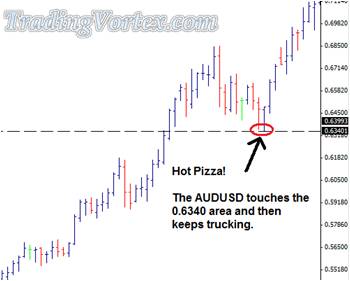
Continuing with the pizza metaphor, the pair approached what it thought was a ready pizza, only to burn itself on the hot pan (in this case the 0.6340 price level). The difference in this case however, is instead of eventually coming back to the 0.6340 level, the pair decided it was too hot to handle and continued to move away.
The unique aspect of resistance zones is that once they are broken they can often act as a new support level of the price. The same is true for support zones as they often become resistance once broken. This is why you see here, the zones are referred to as both support and resistance.
The AUD/USD demonstrates a perfect example: It breaks the 0.6340, a proven support level, only to find resistance when trying to break back above it.
The "Hot Zone" acts as a Support Level:
Click on the image to open the full size version!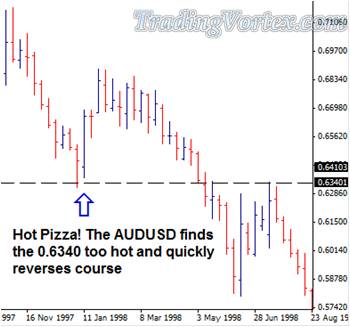
The "Hot Zone" acts as a Resistance Level:
Click on the image to open the full size version!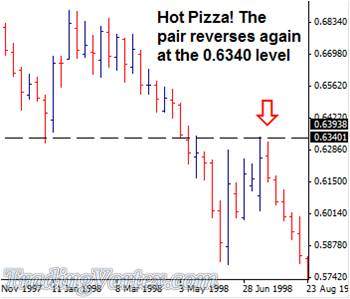
The Depth And Breadth Of Support And Resistance:
Support and resistance zones are visible in many different markets and time frames, and do not just relate to one particular chart or pair.
Below is an example of the EUR/USD on a 4 hour chart:
Click on the image to open the full size version!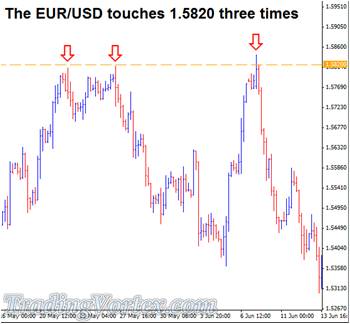
The 1.5820 zone is a clear area of resistance for the pair. You can mark three specific times that the pair attempted to break through this level only to fail. Since this is such a strong resistance line, you can also expect it to provide strong support if the pair eventually breaks through. Below you can see this is the case as the pair finds support from the level that was previously a resistance area.
Currency Pairs Remember Support And Resistance Areas:
Click on the image to open the full size version!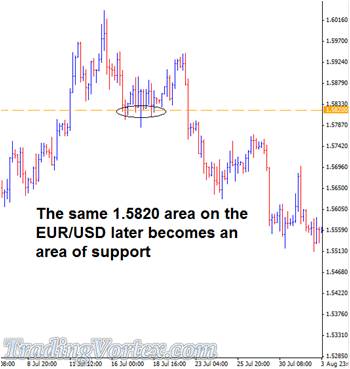
Another important idea about support and resistance zones is that they create imprints, or memories, on currency pairs. A strong support and resistance line is something that will stay with a pair for a long time and chances are the next time the pair approaches it, whether it be in a week or a year, the pair will pause before deciding which way to move.
Nothing Is Guaranteed In The Forex Market:
This being said, one thing that often confuses many Forex traders is that support and resistance lines are not effective 100% of the time. Support and resistance lines do not ALWAYS affect the market, and many times there are other factors that can drive the price straight through a support or resistance line without any delay.
Click on the image to open the full size version!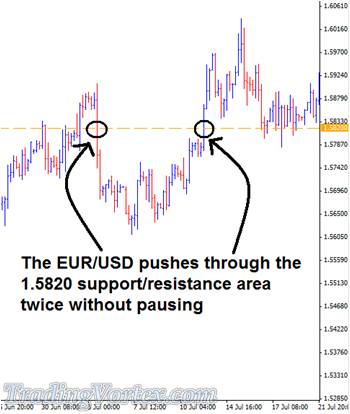
In these two examples above you’ll notice how the price does not even momentarily pause. Instead it moves straight through as if the area has no significance at all. This can confuse a lot of Forex traders because they make the assumption that once a price reaches a support or resistance area it HAS to bounce away. Remember there is no such thing as a sure thing in Forex, only probable outcomes.
Support and resistance lines help improve your odds by outlining a more probable outcome, but in no way should you take this as a 100% guarantee. To successfully trade Forex you need to be able to create a strategy that will maximize your chances of winning, yet leave room for losing trades. One of the most important lessons a Forex trader must learn is how to successfully balance wins and losses. This requires tons of knowledge regarding risk management strategies, money management, system control, and various other aspects that go along with successfully managing your account.
What Is The Point Of Support And Resistance If It Does Not Give 100% Accurate Predictions?
The key is not to focus on placing a trade every time a support/resistance zone is hit. To be successful you need to be correctly positioned for the times support and resistance does prove to provide valid entry points and use proper risk management to maximize your profit during those times. You do not need to know how the price will react every time it approaches a support/resistance zone. You simply need to have rules in place that will enable you to make more money on your winning trades than you lose on your losing trades.
There are several different ways to determine whether a price will react to a support or resistance zone. In order to best take advantage of these zones, additional trade triggers need to be applied. In this course you will learn two Forex trading strategies that combine support and resistance with other potentially effective trade catalysts. These methods can provide successful Forex trading setups when correctly applied and diligently followed.
These trade setups do not occur very frequently, so it is imperative to have patience and wait for your entry formation. However the 2 trading strategies described in this course can be very effective. It is encouraged that you back-test and forward test these methods and to see how they work for you.
Applying Support And Resistance:
Determining Support/Resistance Zones:
Before applying the Forex trading strategies outlined in this course you will need to properly determine support and resistance zones. In this section you will be taught the basics of finding Support and Resistance zones on your charts. You will also learn various characteristics that determine the strength of a support/resistance area.
Since the Forex strategies described in this course do not provide very frequent setups on higher frequency charts it may be in your best interest to practice them on smaller time frame charts, such as the 15 minute or 30 minute time frames. This way you will be able to demo trade these strategies and see the trade setups form.
It will be in your best interest to draw support/resistance zones on your Forex chart from the monthly time frame down to the time-frame you are trading on. You can draw each formation in a different color. This way when your trading formations take place you will know which support/resistance area they are near and be able to use it as a guide. To reiterate, the longer time-frame that the support and resistance lines are drawn on, the more significant the line.
The Rules For Drawing Support And Resistance Levels:
There are 6 rules which can be used to draw effective support and resistance lines:
Rule #1:
Support and resistance lines are Zones, not specific points. Expect prices to reverse in this general area; do not expect prices to turn about instantly. These areas of resistance can easily range up to 30-40 pips in size.
Rule #2:
Wait for confirmation of a price reversal before jumping head first into a trade. Just because you setup an area where price is likely to reverse does not mean you should enter a trade the second the price hits this zone. Instead, wait for a signal that price is reversing and then enter your position.
It is critical to have some form of indicator or confirming signal to let you know price is indeed retreating from the resistance area. There are several different indicators , (MACD, RSI, CCI) signals, and candlestick formations that can be used to confirm a reversal in the Forex markets. A few basic ones are covered only in this section.
Rule #3:
Instead of mentally noting where an area of resistance is, use a thick solid line that can be found in almost any Forex charting package. Play with the positioning of the line and choose the position that visually fits the Forex chart best.
Concentrate on fitting the line to the curves and tops of trends. Play around with your Forex charting package. Sometimes a particular charting style offers too much information. Take the example below:
Click on the image to open the full size version!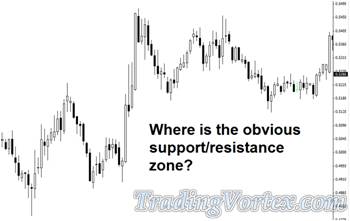
Now if you were to take this same chart and change it to a line chart you would get the following:
Click on the image to open the full size version!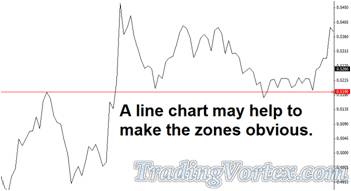
Play around with the different Forex charts and different styles to optimize the view that works best for you.
Rule #4:
Identify support AND resistance areas: Find areas that not only exhibit support or resistance but ones that Act As Both a support and a resistance zone.
Look for areas that have shown both supporting and resisting characteristics over a period of time. These will be the best lines as they show strength on both sides and because of this, reinforce the validity of the line.
Rule #5:
The best support and resistance areas have been around for a long time. Like a good Cheese, support and resistance zones only get better, or in this case stronger, with age.
The longer a support/resistance line has been around, the stronger that line tends to be. This proves specifically useful when a currency pair approaches an area it has not traded near for a long time.
In addition to that, support and resistance lines are stronger on longer time frames. That is to say that a support/resistance zone on a daily Forex chart is stronger than a support/resistance line drawn on a 15 minute chart.
Click on the image to open the full size version!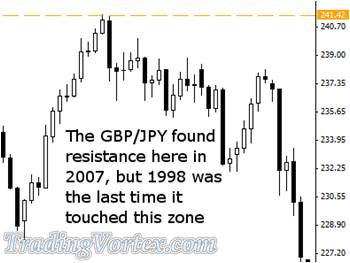
It is important to remember that just because a support or resistance line is old, does not mean it is out of date. On the contrary, the older lines are, the more important the support and resistance zones are.
Rule #6:
Add your own rules and filters that you find helpful.
- These rules are intended to help you find significant support and resistance zones, but by no means they are the only rules that you should or could use.
- Play around with different Forex charts and different time frames and see what you find most useful and most productive.
- Create rules that are simple and easy for you to follow: this way you can continue to apply them later on in your Forex trading career as well as easily adapt them if you come up with different ideas.
- If you find that you need to modify these rules to fit your trading style, then you should do exactly that.
- There are many different ways to apply these rules, and the one thing that many successful traders possess is the ability to adapt what they are taught and customize it to their own specific needs.
- Remember that regardless of the trading strategy, having properly organized support and resistance lines and pivot points drawn on your chart can be a very useful guide in your trading.
- Now that you have your key zones marked on your chart you can begin to apply them with the two Forex trading strategies you are about to learn.
Support & Resistance Zones + Head & Shoulders Formation Strategy:
The Head and Shoulders formation is a commonly know technical trading pattern. The typical formation involves two lower highs and one higher high. It gets its name because it forms a pattern that looks similar to two shoulders with a head in the middle. According to technical analysis theory this formation indicates a potential reversal in the Forex market. The adaptation you will learn in this course could benefit many Forex traders. It can likely lead to more successful trades because of its analysis of the head and shoulders formation relative to support and resistance zones.
You can potentially enhance your Forex trading success with this formation by simply using support and resistance zones to compliment the pattern.
Using Support & Resistance Zones To Compliment The Head & Shoulders Formation:
Below, the 4 hour USD/CHF chart shows that the 1.2500 level has provided resistance for the pair:
Click on the image to open the full size version!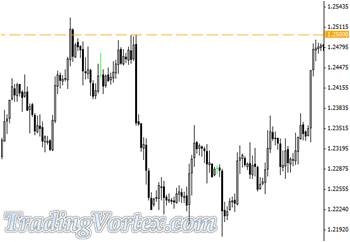
Also the 1.2500 level served as support for the USD/CHF based on the chart below:
Click on the image to open the full size version!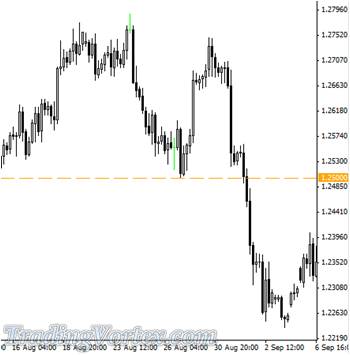
The below chart shows a Head and Shoulders formation. Notice how the pattern forms right on the support and resistance zone of 1.2500. Finding the Head and Shoulders formation is one thing, but when you can combine it with a strong support and resistance line you have an exceptional Forex trade setup.
Click on the image to open the full size version!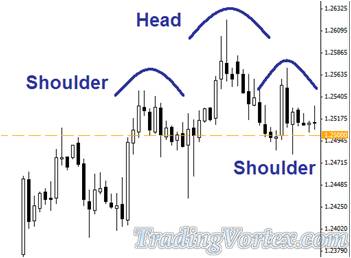
If you take a look at a longer time-frame (in this case the daily chart), you can see that the Head and Shoulders formation has forced the price through the support/resistance zone only to later show weakness and retreat back towards the neckline.
Click on the image to open the full size version!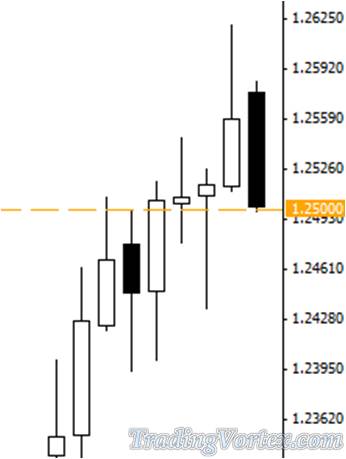
After the fall back towards the resistance zone, the price makes a bounce upwards and creates the last part of the Head and Shoulders formation.
Click on the image to open the full size version!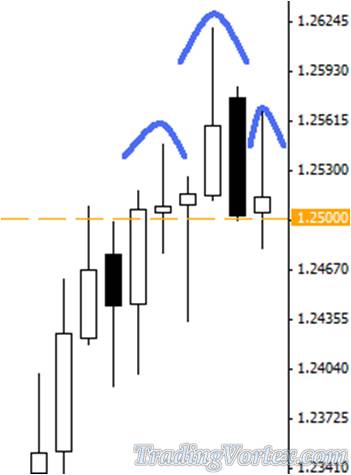
Entering The Head & Shoulders Trade:
The first entry for the formation is to sell when a price trades below the neckline, which in this case will also be the support and resistance zone. To be more specific; sell on the open of the candle following the candle that closed below the neckline (this is also the S/R line) of the formation.
Click on the image to open the full size version!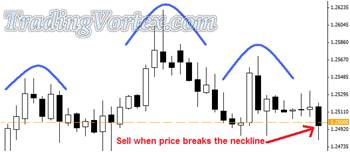
In this example we see that the most recent bar has closed below the support/resistance zone.
Another Way To Enter The Trade:
Instead of selling on the first break, you may also decide to wait for the market to break the neckline with more conviction. In this case you should wait for the price to break the neckline a second time before entering your trade. Once again you will enter on the open of the candle that follows the second candle that closes below the neckline. In addition to this you should place a stop loss a little bit above the top of the last shoulder formation.
Click on the image to open the full size version!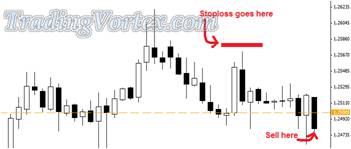
This is not the only point that we would consider a sell on the USD/CHF in this example. We could also wait for the pair to break through the neckline and retrace back up to the neckline. Here we could enter the trade.
Click on the image to open the full size version!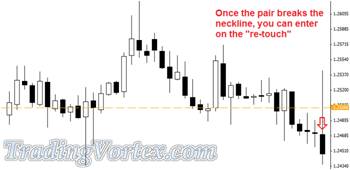
Although this will not always occur, there is a good chance that when the price attempts to re-touch the neckline it will bounce off. This allows us to enter the Forex trade at the neckline after the price has already crossed over.
Exiting The Head And Shoulders Trades:
Exiting the Head and Shoulders trade is fairly straightforward. For this Forex trade you’ll want to first find the difference in pips from the neckline to the top of the head. Then, take that number and set it as your profit target. See the Forex chart below for a perfect example of this:
Click on the image to open the full size version!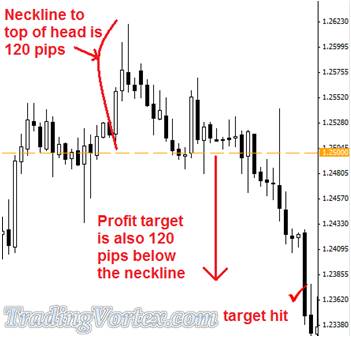
For this course please keep in mind the following rule of thumb: Never risk more than 5% of your account on any single trade.
The Reverse Head And Shoulders Trade Example:
Here is another example using the USD/CHF. On the 4 hour chart you can see that the 1.1680 price exhibits support and resistance zone qualities. The pair has found resistance at this level several times making it a valid zone.
Click on the image to open the full size version!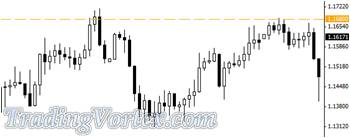
Later, we see that the 1.1680 level provides support "and more resistance" for the USD/CHF.
Click on the image to open the full size version!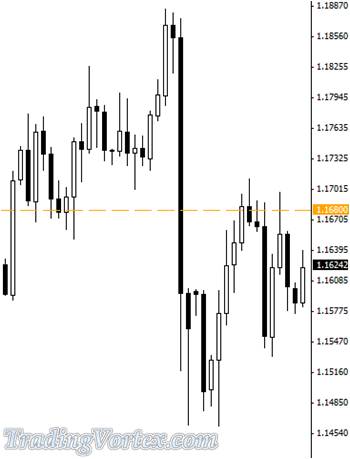
Now we see the formation of a Head and Shoulders, however in this case it is a mirror opposite. This is referred to as an Inverted or Reverse Head and Shoulders.
Click on the image to open the full size version!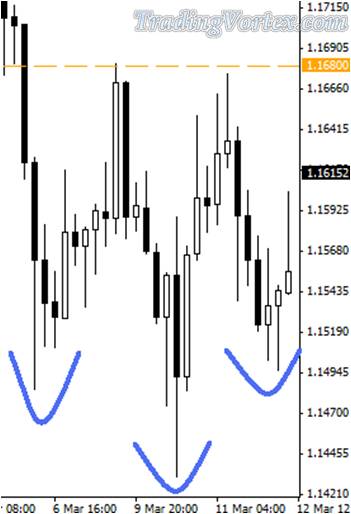
On the daily chart you should see that price has penetrated the neckline which is also the support and resistance zone in this case.
Click on the image to open the full size version!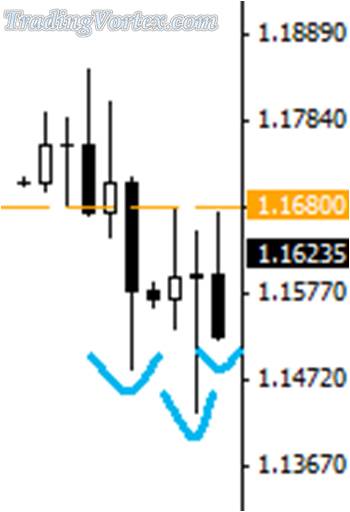
Now you need to wait for the price to break the neckline to trigger your trade setup. Place your stop-loss just beyond the last shoulder’s low and you should be all set.
The distance from the top of the head to the neckline is 248 pips, this will be the profit target and you should place a take profit order at 248 pips above the neckline.
Click on the image to open the full size version!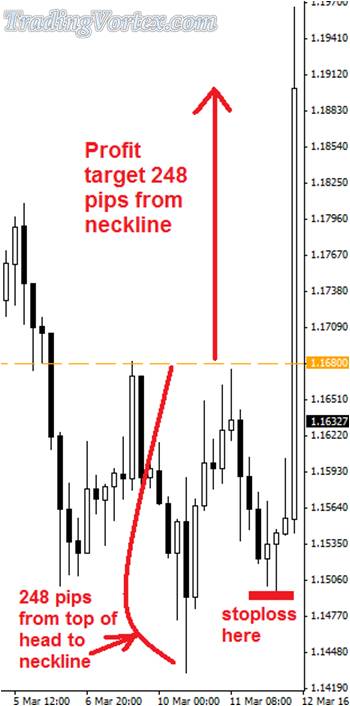
From a risk management stand point it is important to maximize the effectiveness of the trade by using the proper reward risk ratio. This is necessary in both of the strategies taught in this course. A great way to figure out your proper trade size is to use a risk to reward calculator.
Support & Resistance Zones + The Firsty Trade Strategy:
In this section you will learn how to use support and resistance areas to determine the beginning of new trends and thus create potentially rewarding Forex trading opportunities. It will show you how to combine these zones along with the Firsty Trade setup.
This strategy works well for any time frame, from a 15 minute Forex chart to the daily or weekly chart. This strategy will be more effective on longer term time frames like the 4 hour and daily charts. However it is a good idea to practice it on the shorter term time-frames as you are learning.
Place 3 Moving Averages On Your Chart:
Once you mark your chart with appropriate support/resistance hot zones you need to add a trend indicator. In this case, you will have to add 3 moving averages.
For the Firsty Trade, the 3 moving averages are:
- 60 exponential moving average calculated on the close.
- 150 exponential moving average calculated on the close.
- 365 exponential moving average calculated on the close.
Click on the image to open the full size version!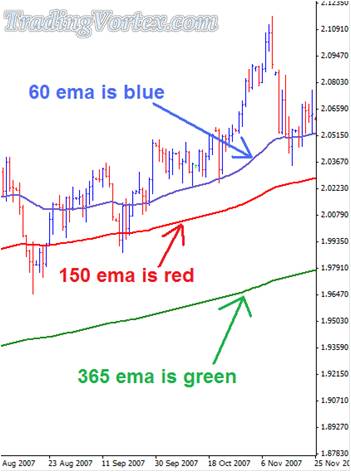
Wait For The Moving Averages To Expand:
Once your support and resistance zones and your moving averages are set, you simply wait and watch for the trade setup to occur. The first sign you need to keep an eye out for is the expanding gap between the moving averages. This indicates a new trend forming and an opportunity is nearing.
Generally there are two ways a trend begins:
- One is when the market eventually moves out of a tight range that it has been trading in.
- The other is when the Forex market reverses off a key area and begins to move in the opposite direction.
In the example below: the pair breaking out of a tightly traded zone:
You should notice how the Forex market is trading in a tight range, which is confirmed by the fact that the moving averages are so close together.
Click on the image to open the full size version!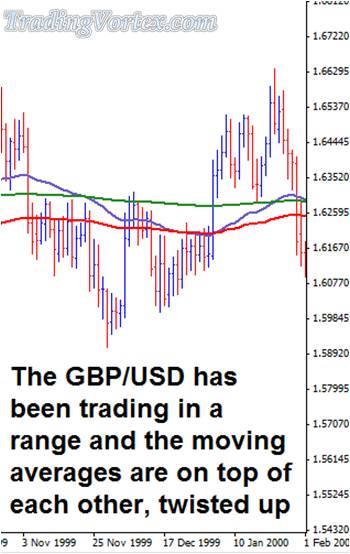
Eventually the market makes a sudden move, and the moving averages start to spread out. This is our first sign that a trend has started to develop.
Click on the image to open the full size version!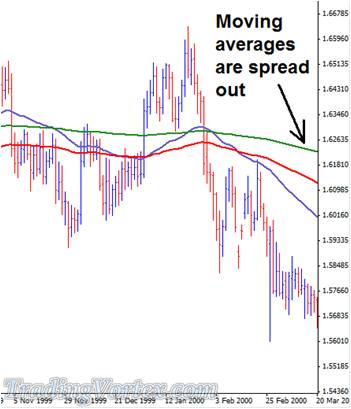
The Entry Point Identification:
Notice the support and resistance zone at the 1.5950 area. Once the price breaks below this area, the trend begins to form.
Click on the image to open the full size version!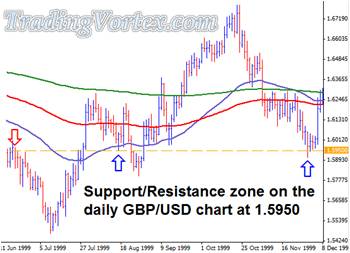
The price has broken the support level and the moving averages have begun to spread apart. However before the trend continues, the price moves back to retest the support and resistance zone it recently broke. This is where you will enter your trade.
Click on the image to open the full size version!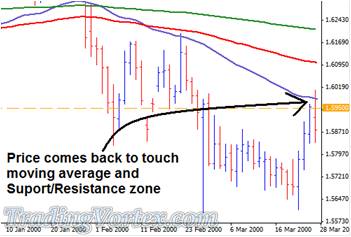
Detailed Instructions On How To Complete This Trade:
When placing your trade you should enter a stop-loss of 10 pips beyond the high or low of the price bar that triggered the trade. For the above example, the stop would have been placed 10 pips above the high of the entry bar. Additionally it helps to see a candle signal that confirms your entry, such as a morning star for a sell entry.
Click on the image to open the full size version!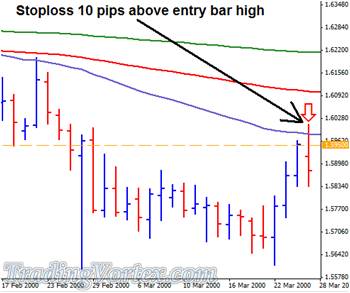
The Firsty Trade Setup Recapitulation
- Draw your support/resistance zones.
- Place 60 EMA, 150 EMA and 365 EMA on the chart. (EMA refers to Exponential Moving Average).
- Wait for the moving averages to separate.
- Wait for the price to pull back and touch one of the moving averages "AND" a support/resistance zone.
- Enter the trade in the direction of the trend after a bullish candle for an uptrend or a bearish candle for entering a downtrend.
- Place the stop-loss 10 pips above the high (downtrend) or below the low (uptrend) of the trigger bar.
Another Example Of The Firsty Trade:
In the example below, the Support And Resistance Areas are found on the 1hr USD/CAD chart.
Click on the image to open the full size version!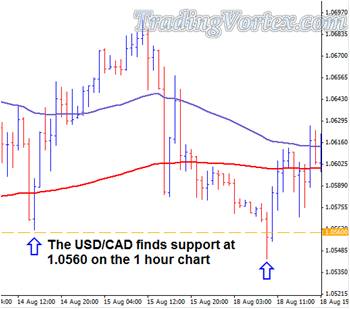
Further down the road the price confirms that this is a valid support and resistance zone.
Click on the image to open the full size version!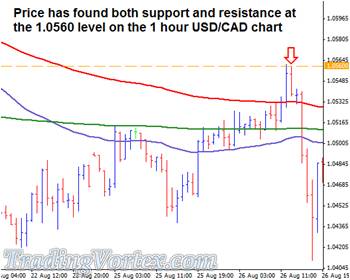
Now you should watch the 60, 150 and 365 Exponential Moving Averages on the chart. Wait for the moving averages to separate; this will signal that a trend might be forming.
Click on the image to open the full size version!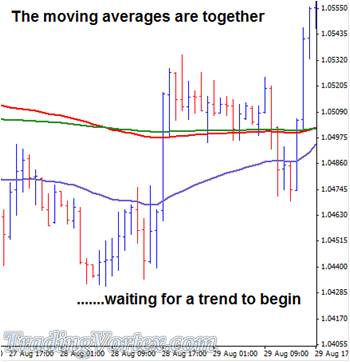
Now you can see that the moving averages have started to separate. You should now be preparing for the price to pull back and if it does you might be able to setup your trade.
Click on the image to open the full size version!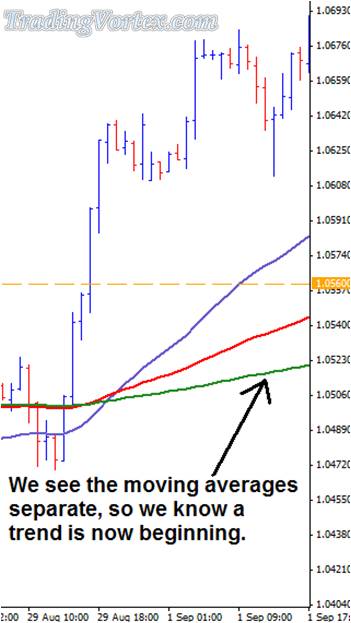
The price has touched both the EMA and the Support And Resistance Line. You are now able to enter your trade once the bar has closed.
Click on the image to open the full size version!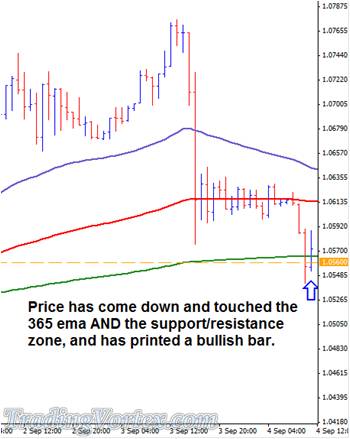
As you can see below, the trend continues and would not hit the stop loss you should have entered. This is a prime example of a Firsty Trade; however it is definitely not the only example. This being said, the most important keys to success with the Firsty Trade strategy is your discipline.
Click on the image to open the full size version!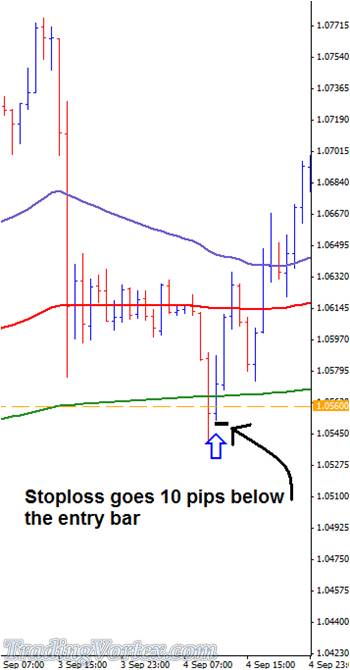
Exiting The Firsty Trade:
Getting into the trade is one thing. However if you are not able to get out of the trade in a profitable manner, than all the hard work you did setting the trade up was for nothing. Below are the suggested methods for exiting a Firsty Trade.
#1 Trailing Stop Exit Strategy:
After entering the Firsty Trade simply apply a trailing stop and let the trade continue until it hits the stop. Many Forex traders prefer this method because it allows the trade to go with the trend until it starts to fade.
The biggest drawback is that if you do not apply a trailing stop that is wide enough, you can quickly get forced out of a trend on a minor pull back. On the other side if you have a very large trailing stop, you are effectively giving up a large portion of the trend and will be further away from exiting the trade at its peak.
#2 Previous High/Low Exit Strategy:
A second method for exiting your Forex trades is to exit at the previous high or low of a price. This often occurs near a support or resistance zone and often Forex traders exit a trade because of the uncertainty near this area. You can see this on the next diagram.
#3 Two Profit Targets Exit Strategy:
The last method uses two different targets for your trade:
- The first target you set at a specific level and close out half your position.
- The other half you leave to continue with the trend and attach a trailing stop to the remaining position.
By doing this you allow yourself to take a quick profit, while at the same time keeping a portion of your trade open and potentially capturing the remainder of a trend.
Firsty Trade Exit Strategy Example:
As you can see in the example below, the price touched the support/resistance zone and the 60 EMA so a Sell Order can be opened.
Click on the image to open the full size version!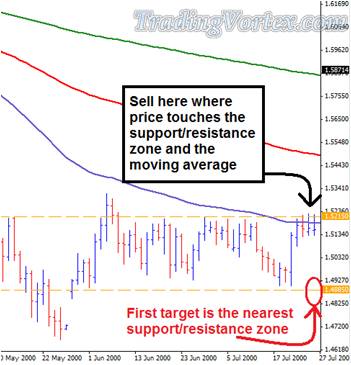
The first profit target could be set at the nearest support area.
Click on the image to open the full size version!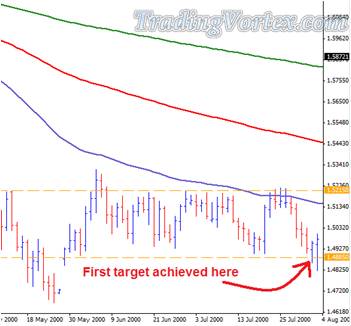
After the first target is achieved you may decide to leave a trailing stop on the remaining position, or you may move the stop-loss to break even on the remaining position and see how far it can go in your favor.
Click on the image to open the full size version!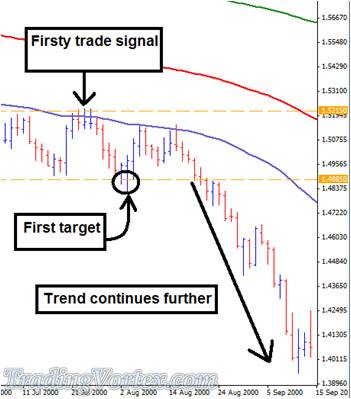
Conclusion:
So there you have it; two simple yet highly effective trade setups that can be used by any Forex trader who can successfully apply discipline and patience. Please use these strategies as a guideline to the overall themes of this course. If you are a successful trader you will do further research and look for ways to expand on these strategies.
The key themes that you should have attained from this course are as follows:
- Use support and resistance lines to enhance your chart analysis regardless of the trading signal you use.
- Be very selective in your trading and make sure that your trade setup is formed before pulling the trigger. Basically don’t chase trades and gamble.
- Use proper risk management and understand that you do not have to be right every time. You just need to put the odds slightly in your favor.
Hopefully you find the Firsty Trade and the Head and Shoulders Trade useful. Many traders use these very same setups and are able to produce successful results. Although the setups are very effective they do not occur too often.
It cannot be stressed enough how important "Patience" and "Discipline" play in both of these strategies. It is also important to note here that trading Forex carries a high degree of risk. You should never trade more money than you are willing to lose.


 TradingVortex.com® 2019 © All Rights Reserved.